
What the Overview Dashboard Provides
The Overview Dashboard brings key Citrix, VDI, Active Directory, licensing, session and machine information together in one central location. It gives administrators an immediate understanding of environment health, usage and connectivity without requiring multiple consoles or disconnected scripts.
Click the dashboard image to enlarge it.
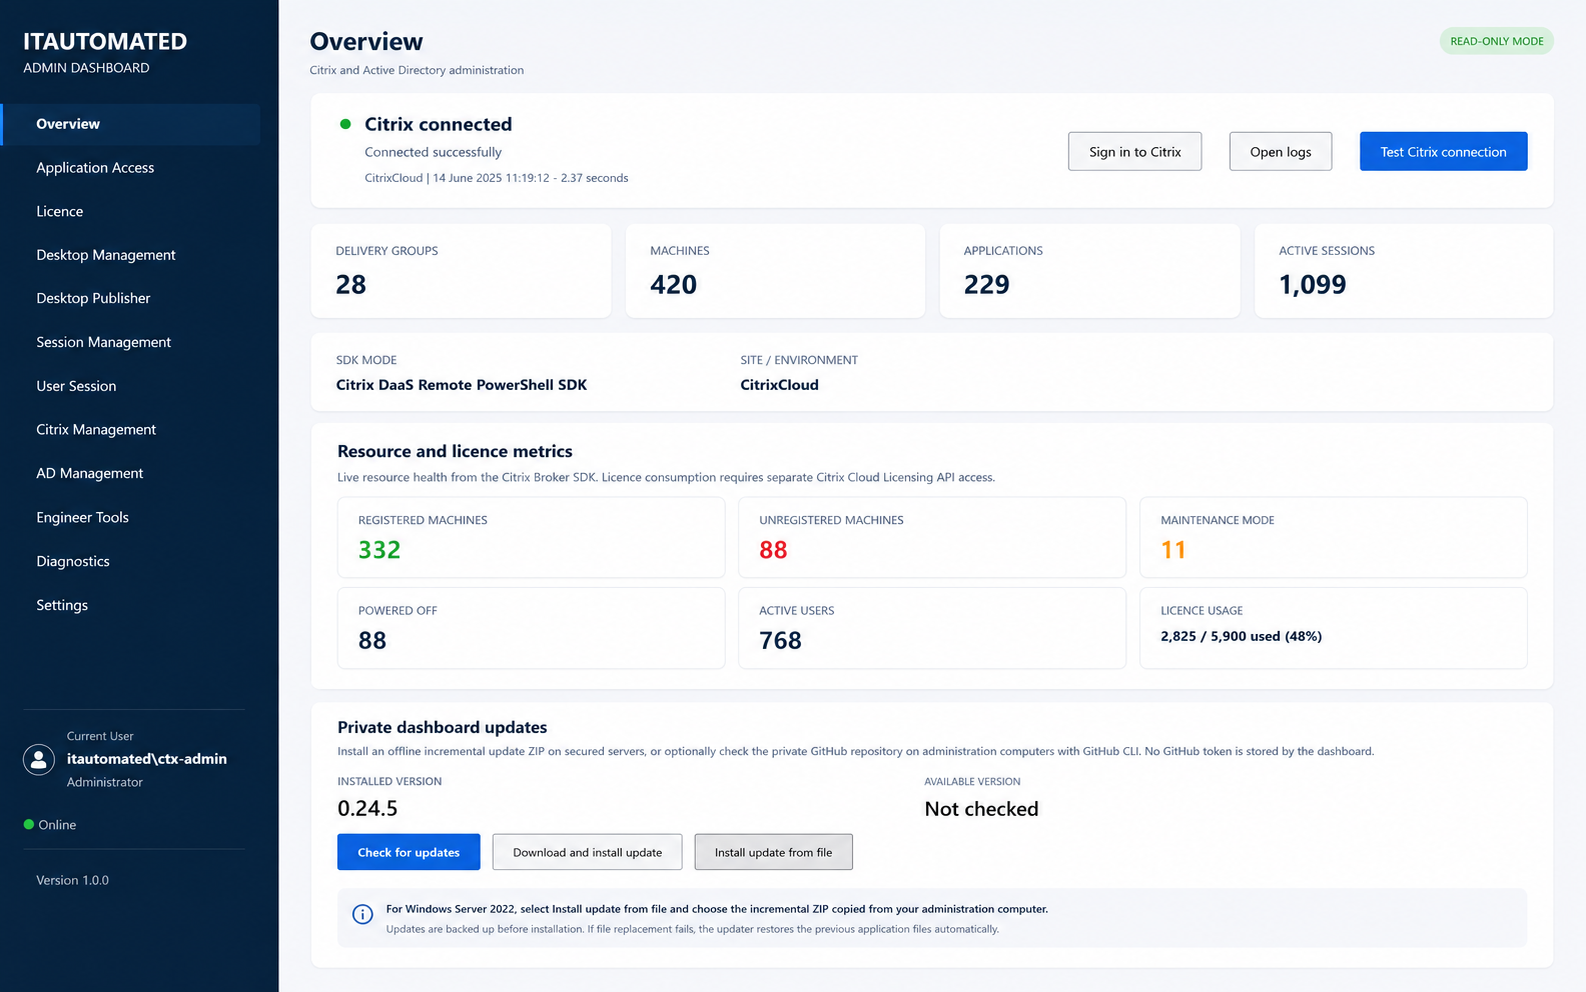
Citrix Connectivity
Monitor Citrix connection status, review the latest successful connection, test connectivity, sign in to Citrix and open application logs directly from the dashboard.
Environment Summary
View current totals for Delivery Groups, machines, published applications and active sessions at a glance.
Machine Health
Quickly identify registered, unregistered, powered-off and maintenance-mode machines.
User and Session Visibility
Review active-user totals and understand current session activity across the connected environment.
Licence Usage
See assigned, available and total licence figures with clear percentage-based utilisation information.
Application Updates
Check installed and available versions, install approved online or offline updates and recover automatically if an update fails.
Designed for Controlled IT Operations
IT-Automated supports read-only operation, clear status indicators, structured logging and controlled administrative workflows. Existing application files are backed up before updates so the previous version can be restored automatically if required.
See Your Environment Clearly
Reduce the time spent switching between management consoles and give administrators one consistent interface for understanding environment health, licensing and usage.